



Sales & AI Reporting
See where customer conversations lead.
Message volume is only one part of the story. TECOBI reporting brings together views of proactive follow-up, inbound AI replies, staff activity and recorded customer outcomes. Managers can ask more useful questions: Who is waiting? Which messages draw replies? Which opportunities become appointments or recorded sales? How long do customers take to buy? For dealer groups, Enterprise Overview brings authorized stores into one comparison so managers can see where customer progress and follow-up need attention.
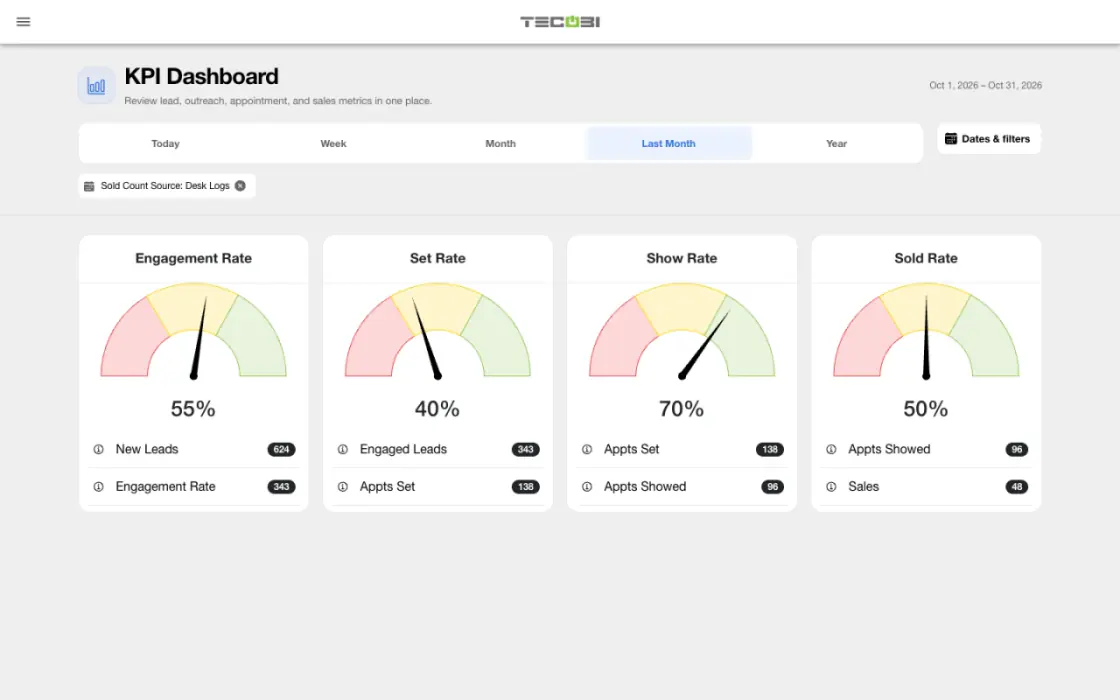
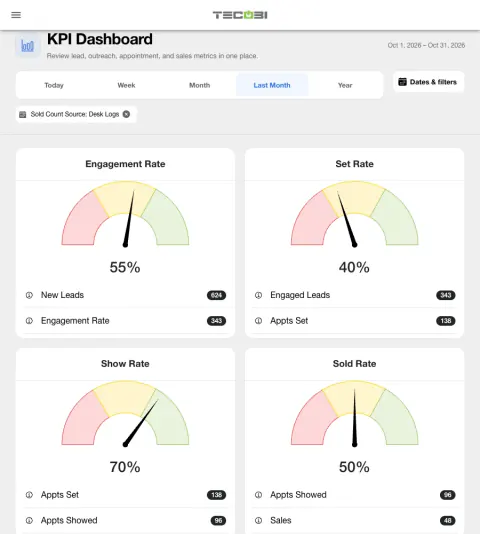
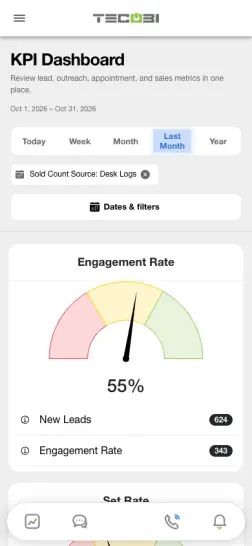
Find where a cohort needs attention
Lead volume gives you a starting point. Bookings and attended visits show where to open the underlying records and ask a more specific question.
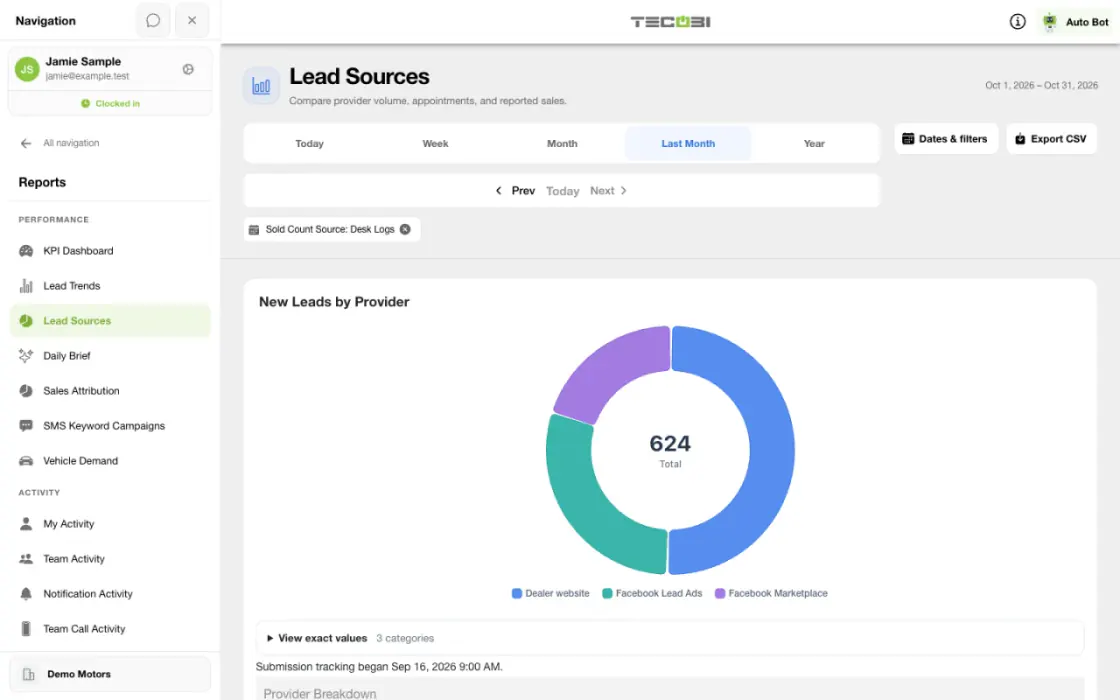
What it helps you do
Understand the different jobs AI performs.
AI Reports separate Auto Bots® outbound follow-up from Response Bot inbound reply activity, with relevant delivery, response, routing and appointment measures.
See customers who buy later.
Time-to-sale reporting groups recorded sales by lead age and shows the time from the last lead submission to the sale, making longer customer journeys visible.
Connect the report to the work.
Use available team, call, campaign, source and sales views to review the activity behind a metric and identify follow-up questions.
See the gap between shopper interest and your inventory.
Vehicle Demand puts recorded vehicle interest, sales and current in-stock inventory side by side. Use it to identify groups worth reviewing for acquisition, promotion or a more useful customer follow-up.
Give every store a clearer next move.
Enterprise Overview brings new leads, engagement, appointments, recorded sales and current follow-up gaps together across selected dealerships. Compare stores, then open the customer detail you are authorized to review.
How it works
Start with a specific business question.
Choose the report that matches the question: customer response, team activity, campaign performance, sales attribution or time to sale.
Set the dealership and time period.
Review the selected account, dates and available filters so the figures refer to the intended scope.
Read what each metric counts.
Distinguish messages sent from delivered, appointments created from scheduled or shown, and recorded sales from other activity.
Use the supporting detail.
Open available breakdowns or relevant records to understand the result. Coach the process or adjust the workflow based on the evidence rather than a single headline number.
Compare the customer signals fairly.
Check whether a count represents a new lead, a repeat submission, a recorded sale or current inventory. Keep the report’s date range, selected sales source and tracking coverage in view before deciding what to change.
Compare the stores you manage.
With report access and more than one assigned dealership, open Reports → Enterprise Overview. Choose dealerships, dates and a reporting timezone, then Apply filters. Review Overview or Dealership scorecard, open a count for permitted customer detail, or use Export CSV for the selected stores. Search and sorting change the on-screen scorecard; the export includes all stores in the applied selection.
Setup and availability
Available report views and drill-down access depend on account permissions and configuration.
Reports describe recorded data and defined attribution rules; they do not guarantee results or establish causation.
Example screenshot values illustrate the interface and are not promised dealership performance.
Submission and assignment history depend on when tracking began. A period can have partial or unavailable coverage.
Vehicle Demand uses recorded interest and current in-stock inventory. It does not measure every shopper, predict future sales or automatically purchase inventory.
Customer story · Johnson City Nissan
How Johnson City Nissan Linked 92 of 179 Monthly Sales Back to TECOBI
Wes Mckeehan and the Johnson City Nissan team use TECOBI to manage lead response and long-tail follow-up without a BDC. The platform keeps outreach moving, routes real conversations back to salespeople, and gives management a clearer line of sight into the work that actually drives appointments and sold units.
Questions dealers ask
What is the difference between Auto Bots® and Response Bot reporting?
Auto Bots® reporting describes proactive outbound AI follow-up, including available message and response measures. Response Bot reporting describes eligible inbound AI reply attempts, timing, routing and related appointment activity.
How is time to sale measured?
The supported monthly view measures each recorded sale from the last lead submission at or before that sale. The month follows the dealership’s timezone, and repeat purchases count as separate sale events.
Can reports show sales from older leads?
Yes. Time-to-sale views group recorded sales by lead age, including older opportunities. The distribution can help you understand the store’s customer cycle, but it does not prove that a particular message caused the sale.
Why might two reports show different totals?
Reports may use different date fields, eligibility rules, scopes or outcome definitions. For example, an appointment created in a period is different from one scheduled to occur in it. Read the report’s definitions and filters before comparing totals.
What if an expected outcome is missing from a report?
Check the account, date range and whether the underlying event was recorded with the required outcome. If it still appears wrong, ask TECOBI support to investigate the relevant report and record through a secure support request.
Which vehicles are shoppers asking about that we do not have in stock?
Vehicle Demand compares recorded vehicle likes and buying interests with recorded sales and current in-stock inventory, grouped by make, model and condition. It helps you find interest with little or no matching stock. These are recorded interest signals, not a count of unique buyers or a prediction of future sales.
Does Vehicle Demand show the inventory we had during the selected dates?
The inventory comparison uses vehicles currently marked in stock, even when you choose a historical demand period. The report’s uncovered demand compares recorded interest, recorded sales and current stock; it is not a forecast. The headline Uncovered Demand tile identifies the largest remaining demand group, rather than adding every group together.
What is the difference between New Leads and Submissions?
New Leads counts customer records created in the selected period. Where submission tracking is available, Submissions also counts separate inquiries from existing customers. A repeat inquiry can add a submission without creating another customer record. Tracking start and partial-history notices matter when comparing periods.
How should we read a lead source’s closing percentage?
The supported source report divides recorded sales by New Leads for the selected period. Sales follow the chosen sold-count source and the date the sale happened; the source may be sold Desk Logs or sold appointment leads. A customer who first arrived earlier can buy during the selected period, and separate sold Desk Logs can count as separate sales. Closing percentage is therefore not the eventual conversion rate of only the new customers who arrived in that period.
Does Assigned Leads mean every lead a salesperson currently owns?
Where assignment tracking is supported, the count covers distinct leads with a recorded assignment to that salesperson in the selected date range, limited to leads the viewer can access. New assigned leads also require that the customer record was created in that period. Tracking coverage does not reconstruct all ownership history from before tracking began.
How does Enterprise Overview compare new leads, appointments and sales?
New leads are Sales acquisitions received in the period, excluding transfer arrivals and DMS offers. Engaged leads have at least two inbound texts in that period. Appointment counts cover those new leads with a non-cancelled appointment created in the period; shows are recorded shows from those appointments in the period. Recorded sales count distinct sold vehicles in the period, including older leads; a sold log without a recorded sold vehicle counts once. Engagement and appointment rates divide by new leads; show rate divides by appointment customers. Group rates use combined counts, not an average of store percentages. Sales are a separate period measure, not a new-lead conversion rate.
Which stores and periods can I compare in Enterprise Overview?
The report requires report access and membership in more than one dealership. Choose from your assigned stores and a date range of up to 366 days. The comparison uses the immediately preceding interval of equal elapsed length; an open period stops at update time. Rows with fewer than 20 new leads are flagged as small samples. A zero means no matching TECOBI records, not proof that every outside source is connected. Customer detail still follows your lead access, so its visible customer count can differ from a group total or vehicle sales count.
ASK ME ABOUT IT
BETTER TOGETHER
Connect the next step.
Explore how these TECOBI solutions fit into your dealership’s workflow.