



Lead source reporting
See where your dealership opportunities are coming from.
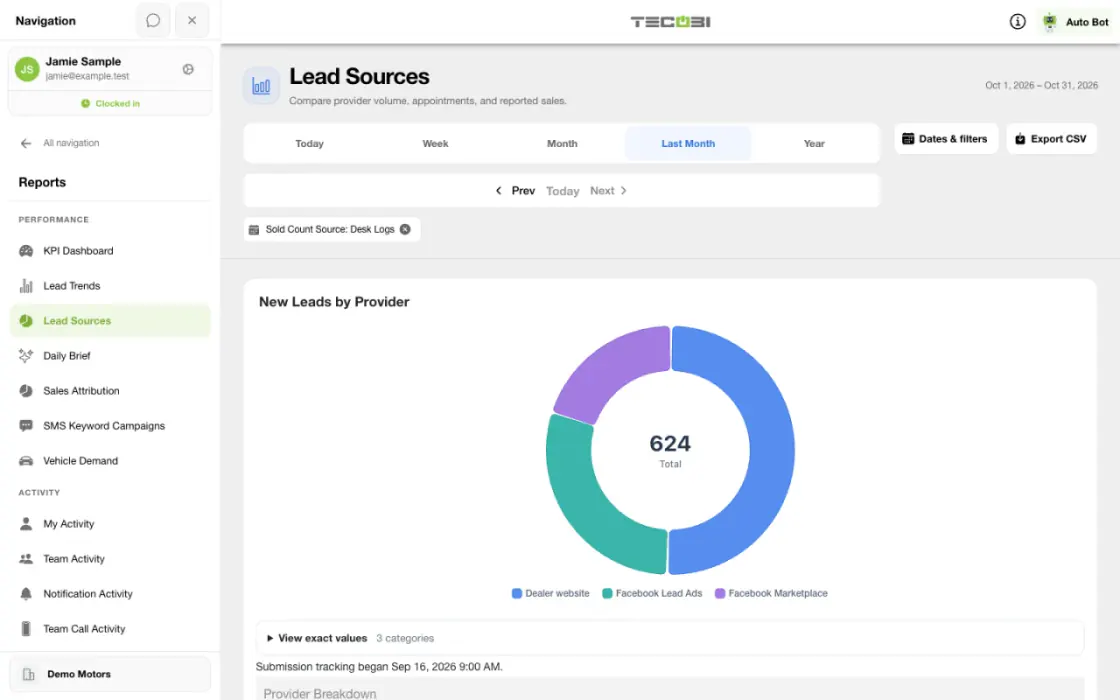
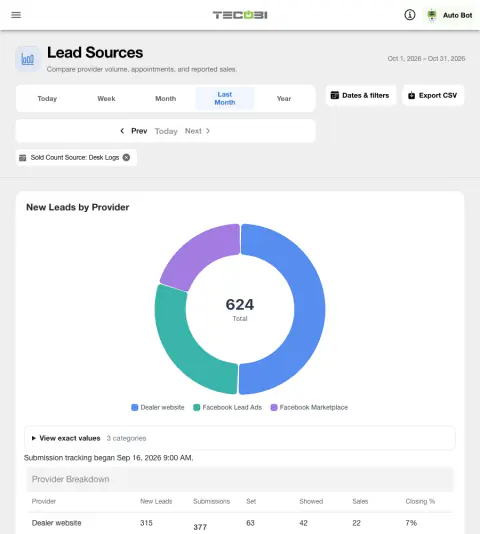
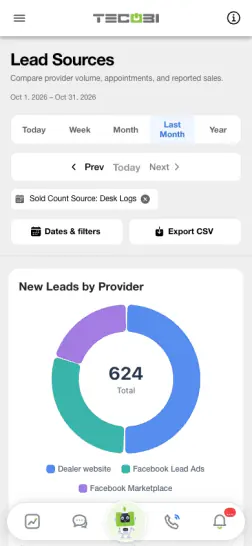
Your dealership receives opportunities from many places. The Lead Sources report brings available provider activity into one view so your team can compare recorded new leads, appointments and sales with the context behind the numbers.
Follow a source beyond the first inquiry
A provider row can tell you how many sales leads it supplied. Drill into lead and sale records before interpreting what each source contributed.
Compare provider activity in one place
Look at the sources associated with your dealership’s recorded opportunities.
- The Provider Breakdown groups available new leads, leads with an appointment set, leads shown and recorded sales by the lead’s recorded source.
- Set and Showed each count distinct leads: Set uses appointment creation date, while Showed uses the recorded show date in the selected period.
- New Leads counts customer records created during the selected dates, while recorded sales use when the sale happened.
- Select an available count to inspect the underlying customer or appointment details your account can access.
- The report supports a selected date range of up to 366 days and available inventory and sold-source filters.
Understand what the sales and closing numbers mean
The same reporting period can include different groups of customers.
- Sales follow the selected sold-count source: sold Desk Logs or sold appointment leads.
- Desk Log mode can count multiple sold Desk Logs associated with the same lead.
- For each provider returned by the leads report, closing percentage divides recorded sales by New Leads for the selected period. It returns 0% when New Leads is zero; activity-only rows without a matching leads row may show a dash.
- The summary closing percentage is an equally weighted average of the provider percentages returned by the leads report, rounded to a whole percent. It is not total sales divided by total New Leads.
- A customer who first arrived earlier can be sold during the selected period.
- That percentage is not the eventual conversion rate of only the customers created in the period, and recorded source or sale does not prove that a provider caused the sale.
Review your data before drawing conclusions
Use the report to ask better questions about the customer journey.
- Compare source labels, date range, inventory filter and sold-source setting before comparing results.
- A missing, Unknown or unexpected source can reflect the information recorded with the customer; review the source and customer record before attributing an outcome.
- Where submission tracking is available, a separate Submissions count can include repeat inquiries from existing customers; coverage and start dates can limit comparisons.
Take the next step with your team
Move from a summary to the recorded activity behind it.
- Open available provider-level counts to review the underlying customer and appointment records.
- The report can export provider rows and totals, including New Leads, Set, Showed and the selected sold count.
- Use the results alongside customer conversations and campaign context when deciding where to focus follow-up or investigate differences.
- Available data, report access and drilldowns depend on dealership setup and user permissions.
Put the workflow into practice.
Open Reports → Lead Sources with the appropriate dealership report access.
Choose the reporting dates and available filters, including inventory type and sold count source.
Compare provider rows, then open available lead or appointment details to review the underlying activity.
Export the report and use the results with the date range and metric definitions in mind.
Connected TECOBI tools
Questions dealers ask
What is the difference between New Leads and Submissions?
New Leads counts customer records created in the selected period. Where submission tracking is available, Submissions also counts separate inquiries from existing customers. A repeat inquiry can add a submission without creating another customer record. Tracking start and partial-history notices matter when comparing periods.
How should we read a lead source’s closing percentage?
The supported source report divides recorded sales by New Leads for the selected period. Sales follow the chosen sold-count source and the date the sale happened; the source may be sold Desk Logs or sold appointment leads. A customer who first arrived earlier can buy during the selected period, and separate sold Desk Logs can count as separate sales. Closing percentage is therefore not the eventual conversion rate of only the new customers who arrived in that period.
Setup and availability
Sales & AI Reporting: setup and availability
Available report views and drill-down access depend on account permissions and configuration.
Reports describe recorded data and defined attribution rules; they do not guarantee results or establish causation.
Example screenshot values illustrate the interface and are not promised dealership performance.
Submission and assignment history depend on when tracking began. A period can have partial or unavailable coverage.
Vehicle Demand uses recorded interest and current in-stock inventory. It does not measure every shopper, predict future sales or automatically purchase inventory.
Automotive CRM & Lead Management: setup and availability
Available tools depend on dealership configuration and user permissions.
Integration coverage varies by provider; TECOBI does not automatically synchronize every field with every CRM or DMS.
Pipeline and activity screens describe recorded work; they do not guarantee a sale or prove why it happened.
Survey access depends on dealership membership and user role or assignment. Automatic post-sale survey requests require enabled configuration and an active sending workflow; no universal schedule, delivery or response is promised.
Text Ninjas is an optional service. Confirm the service scope, coverage hours, handoffs and current pricing with TECOBI. No particular staffing ratio, response-time guarantee or managed phone service is promised here.
Automotive Advertising & Lead Generation: setup and availability
Managed advertising requires dealership-specific scope, account setup and budget approval.
Delivery and lead volume depend on the campaign, audience and advertising platform; no result is guaranteed.
A recorded lead source or campaign outcome is not, by itself, proof that an ad caused a sale.
ASK ME ABOUT IT