



Dealership KPI Dashboard
See where your dealership’s customer journey needs attention.
A busy dealership needs more than a count of leads. TECOBI’s KPI Dashboard helps managers compare recorded customer activity and sales outcomes, then open available customer lists to investigate where the next opportunity may be waiting.
Read the rate and the count together
A show rate answers a different question than a booking rate. Read the denominator before deciding what needs work.
- Share of leads with a booking
- 3.4%331 of 9,607
- Share of booked leads who attended
- 36%119 of 331
- Share of attended leads with a matched delivery
- 57.1%68 of 119
Follow the recorded customer journey
Start with the stages that matter to your team, then investigate the customers behind the numbers.
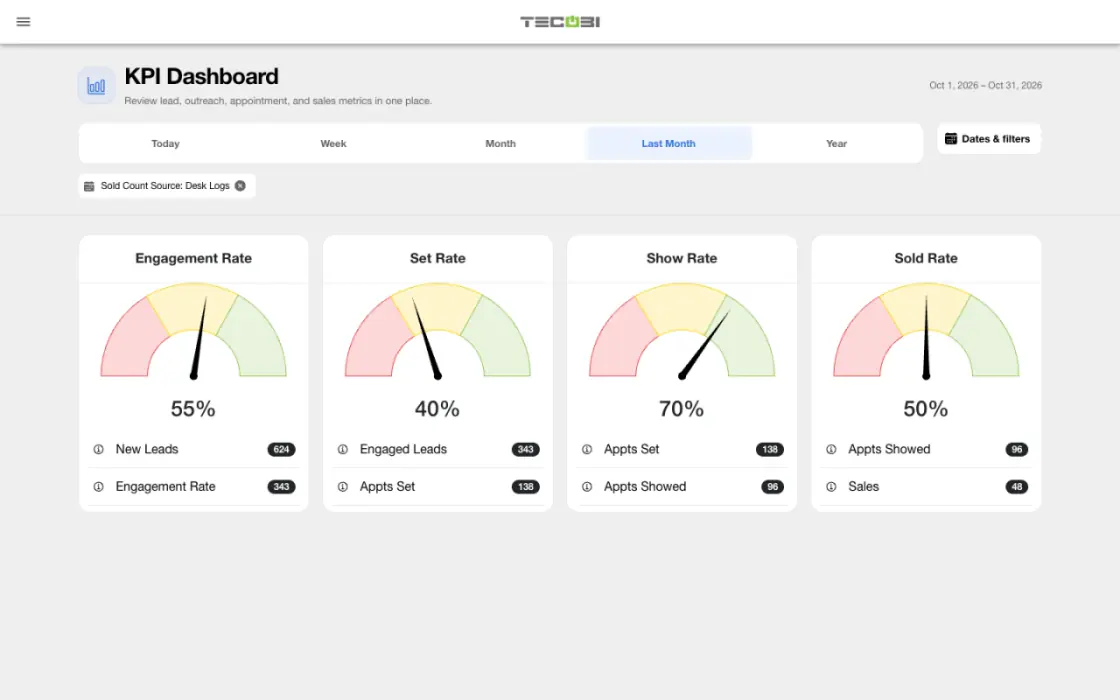
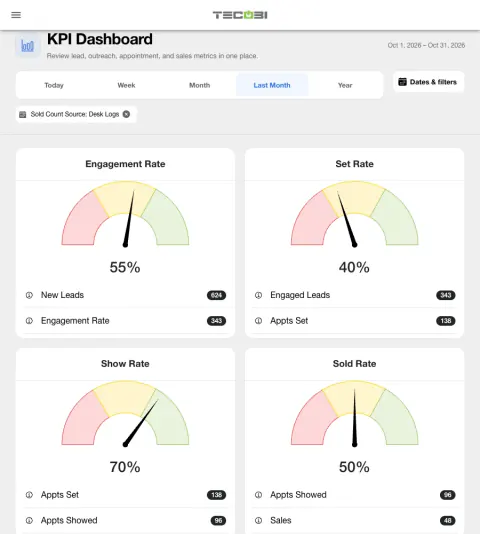
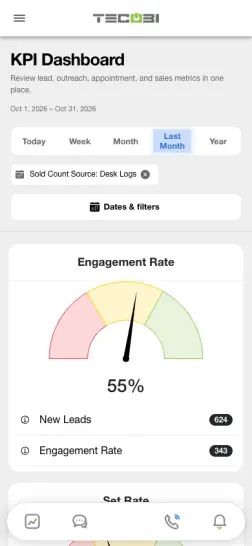
- The KPI Dashboard shows new leads, engaged leads, distinct leads with appointments set or showed, and a selected measure of recorded sales for the report dates.
- The dashboard’s engagement calculation considers a lead engaged when at least two inbound text messages are recorded in the selected period and the lead meets the report filters and eligibility checks.
- Where the data is available, a metric can open a list of customers behind it; use those records to understand the next action.
- Recorded activity, an appointment and a sale are separate events. A report can surface questions for the team, but it does not establish what caused a sale.
Choose the view that fits your question
A report period and a lead cohort are different ways to look at the same customer journey.
- In the default view, eligible engagement and appointment activity can include customers who became leads before the selected dates. New leads still reflect the report’s lead-creation period.
- Strict Funnel narrows later stages to eligible leads from the earlier stages in the selected period. It is a reporting filter, not proof that every event happened in a particular order or that a message caused an outcome.
- Filters include lead source, classification, inventory type and available appointment or sales-count options. The available choices and results depend on dealership setup and access.
- Counts can differ between reports when their filters, time periods, counting rules or recorded data differ. Review those settings before comparing numbers.
Understand the sales count
Use the definition that matches the decision you are making.
- The KPI Dashboard can use sold Desk Logs or appointment sold records as its sales-count source. The label changes with the selected option.
- Desk Log sales count recorded sale events; one lead can have more than one recorded sale. Appointment sold counts distinct leads with qualifying sold appointments and can differ.
- When a single Facebook lead source is selected, available Facebook spend and cost-per-sold measures are shown alongside the selected sales count; these figures depend on connected data.
- A cost-per-sold figure is a calculation using the displayed spend and selected sold count. It does not by itself prove that an ad caused a sale.
Compare dealerships with a separate KPI report
For an authorized group, Dealership KPIs provides a separate comparison across selected stores.
- Dealership KPIs offers a table of working and paused pipeline, engagement, appointments and recorded sales for selected dealerships.
- The report can use a new-leads-only view and selected source, classification and pipeline-status filters. Working and paused pipeline are current-state snapshots subject to the report cache, rather than activity restricted to the selected dates.
- Dealership KPIs has its own calculations and available filters. Its totals are not interchangeable with the single-dealership KPI Dashboard without checking the definitions.
Put the workflow into practice.
Open Reports → KPI Dashboard for an authorized dealership and choose the report dates.
Select the available lead source, classification and inventory filters that fit the question you are investigating.
Compare the lead, engagement, appointment and recorded sales views, and open the available lead list for a metric when you need more context.
Use Dealership KPIs for the separate dealership comparison view when available, and investigate differences in filters and calculation before comparing totals.
Connected TECOBI tools
Questions dealers ask
Why might two reports show different totals?
Reports may use different date fields, eligibility rules, scopes or outcome definitions. For example, an appointment created in a period is different from one scheduled to occur in it. Read the report’s definitions and filters before comparing totals.
What if an expected outcome is missing from a report?
Check the account, date range and whether the underlying event was recorded with the required outcome. If it still appears wrong, ask TECOBI support to investigate the relevant report and record through a secure support request.
Setup and availability
Sales & AI Reporting: setup and availability
Available report views and drill-down access depend on account permissions and configuration.
Reports describe recorded data and defined attribution rules; they do not guarantee results or establish causation.
Example screenshot values illustrate the interface and are not promised dealership performance.
Submission and assignment history depend on when tracking began. A period can have partial or unavailable coverage.
Vehicle Demand uses recorded interest and current in-stock inventory. It does not measure every shopper, predict future sales or automatically purchase inventory.
Automotive CRM & Lead Management: setup and availability
Available tools depend on dealership configuration and user permissions.
Integration coverage varies by provider; TECOBI does not automatically synchronize every field with every CRM or DMS.
Pipeline and activity screens describe recorded work; they do not guarantee a sale or prove why it happened.
Survey access depends on dealership membership and user role or assignment. Automatic post-sale survey requests require enabled configuration and an active sending workflow; no universal schedule, delivery or response is promised.
Text Ninjas is an optional service. Confirm the service scope, coverage hours, handoffs and current pricing with TECOBI. No particular staffing ratio, response-time guarantee or managed phone service is promised here.
Salesperson Performance & Coaching: setup and availability
Call insights depend on available recordings and processing; a transcript or summary may be delayed, partial or unavailable.
AI summaries, sentiment labels and scores can be mistaken. Managers should review the underlying conversation before using them to make judgments.
Conversation and reporting access follows the user’s permissions. Available metrics depend on the selected report, date range and recorded activity.
The screenshots use demonstration identities and figures. They do not establish a performance benchmark, a sales result or a live customer outcome.
Call-needed wait and assignment measures depend on recorded event history and tracking coverage. Missing tracking is not zero activity.
Activity and scoring labels are signals to review. They do not prove a successful conversation, an appointment or the cause of a sale.
ASK ME ABOUT IT