



Lead Trends
See how your lead mix and recorded sales change over time.
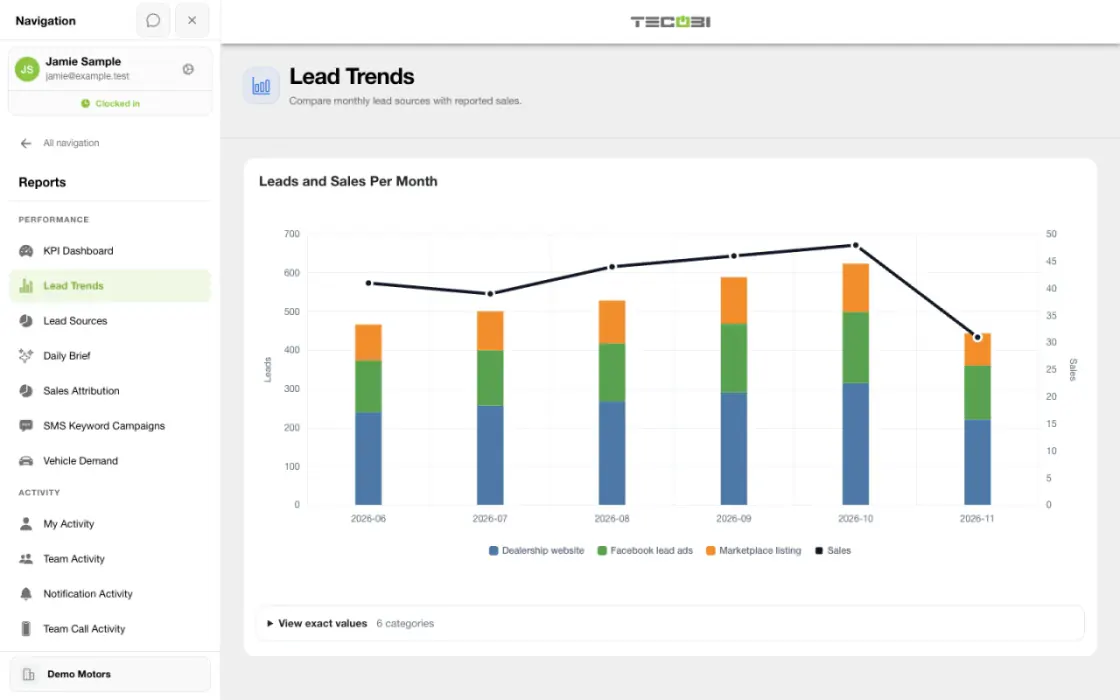
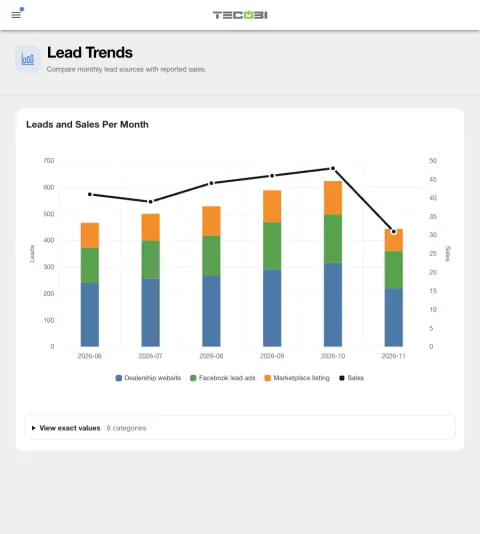
Your dealership’s lead mix changes over time. Lead Trends puts monthly lead sources and recorded sales on one chart so managers can spot changes worth investigating and ask better questions about their follow-up.
Compare results by when the lead arrived
When a month stands out, check what changed across sources and whether later sales were linked to the leads received that month.
- 1Aug
- 1Sep
- 3Oct
- 1Nov
- 0Dec
- 4Jan
- 12Feb
- 14Mar
- 11Apr
- 13May
- 6Jun
- 17Jul
See the lead mix across months
Look beyond a single month to notice a change in the volume or mix of incoming opportunities.
- The chart shows a rolling 12-month view, including the current partial month. Periods are anchored to the dealership’s configured local date; review records near month boundaries when timing matters.
- Bars group eligible created lead records by their recorded source. Missing provider names appear as Unknown; DMS offer records and transfer-origin segments are excluded from this acquisition view.
- The chart keeps up to 12 sources with the largest totals across the displayed period; remaining sources are combined as Other.
- A new lead count is not a count of every repeat submission, message, or customer contact.
Compare recorded sales in context
Sales lines give you another perspective on the same monthly timeline.
- The chart can show recorded desk-log sales and available DMS sales by new, used, certified and other classifications, on a separate sales axis.
- DMS counts use available delivery dates and exclude wholesale sales. Results depend on the data your dealership has recorded or synchronized.
- Lead bars use lead-creation months; sales lines use recorded sale or delivery timing. They are not necessarily the same customers or a source-specific conversion cohort.
- The chart does not establish that a lead source caused a sale. Use it to identify questions, then review the appropriate report and customer context.
Make the numbers useful
Turn a visible change into a practical next step for your team.
- Use the chart legend to focus on available series and the values table to inspect displayed counts.
- Compare the current partial month with complete months carefully; seasonal changes, attribution and record coverage can affect the view.
- Results can be cached for up to 10 minutes, so a recent change may not appear immediately.
Put the workflow into practice.
Open Reports → Lead Trends for the selected dealership with the appropriate access.
Review the monthly source bars and the available recorded-sales lines on their separate axes.
Use the chart legend and the values table to compare the months and series you want to understand.
Investigate changes with Lead Sources reporting and the customer records your role can access.
Connected TECOBI tools
Questions dealers ask
Why might two reports show different totals?
Reports may use different date fields, eligibility rules, scopes or outcome definitions. For example, an appointment created in a period is different from one scheduled to occur in it. Read the report’s definitions and filters before comparing totals.
What if an expected outcome is missing from a report?
Check the account, date range and whether the underlying event was recorded with the required outcome. If it still appears wrong, ask TECOBI support to investigate the relevant report and record through a secure support request.
Setup and availability
Sales & AI Reporting: setup and availability
Available report views and drill-down access depend on account permissions and configuration.
Reports describe recorded data and defined attribution rules; they do not guarantee results or establish causation.
Example screenshot values illustrate the interface and are not promised dealership performance.
Submission and assignment history depend on when tracking began. A period can have partial or unavailable coverage.
Vehicle Demand uses recorded interest and current in-stock inventory. It does not measure every shopper, predict future sales or automatically purchase inventory.
Automotive CRM & Lead Management: setup and availability
Available tools depend on dealership configuration and user permissions.
Integration coverage varies by provider; TECOBI does not automatically synchronize every field with every CRM or DMS.
Pipeline and activity screens describe recorded work; they do not guarantee a sale or prove why it happened.
Survey access depends on dealership membership and user role or assignment. Automatic post-sale survey requests require enabled configuration and an active sending workflow; no universal schedule, delivery or response is promised.
Text Ninjas is an optional service. Confirm the service scope, coverage hours, handoffs and current pricing with TECOBI. No particular staffing ratio, response-time guarantee or managed phone service is promised here.
Automotive Advertising & Lead Generation: setup and availability
Managed advertising requires dealership-specific scope, account setup and budget approval.
Delivery and lead volume depend on the campaign, audience and advertising platform; no result is guaranteed.
A recorded lead source or campaign outcome is not, by itself, proof that an ad caused a sale.
ASK ME ABOUT IT